Performance Profiling Tools
Developers often have a desire to speed up their code to make it run more quickly. Some well-known advice on this topic, attributed to the programmer Michael A. Jackson, says:
Rules of Optimization:
Rule 1: Don't do it.
Rule 2: (for experts only) - Don't do it yet.
Sometimes a third rule is added:
Rule 3: Profile before optimizing.
The key point here is not to optimize your code until you have a correct, clearly written, and unoptimized solution. Then, use tools to identify where the bottlenecks are and focus on them. Software performance often follows a so-called 80/20 rule where 20% of the code takes 80% of the execution time (and typically the ratio is much higher than this).
Profiling tools help you identify where the time is being spent in your application so you can focus on that 20% or less of code that is responsible for the majority of execution time.
Keeping these rules in mind, let's look at some of the common profiling tools of interest to Qt developers.
gcc/gprof
The GNU gcc/g++ compiler supports performance profiling. Essentially, you need to compile and link your code with the -pg option and then run it normally. On exit, your program will save profiling data in a file called gmon.out. You can then use the gprof program to produce a report based on the collected data.
When using qmake, you can set suitable flags for compiling and linking on the qmake command line like this:
qmake QMAKE_CXXFLAGS+=-pg QMAKE_LFLAGS+=-pg CONFIG+=debug
Alternatively, you can set these flags in your qmake project file.
Building for debug (as I did above) it also useful so that the report can provide more meaningful symbols and, optionally, even annotated source code. Here is some sample partial output of gprof when run on a Qt-based program:
Flat profile:

Each sample counts as 0.01 seconds.
  %   cumulative   self              self     total
 time   seconds   seconds    calls  us/call  us/call  name
100.01      0.01     0.01       42   238.12   238.12  Spreadsheet::recalculate()
  0.00      0.01     0.00  1090996     0.00     0.00  Spreadsheet::cell(int, int) const
  0.00      0.01     0.00     2624     0.00     0.00  qt_noop()
  0.00      0.01     0.00     1558     0.00     0.00  QArrayData::data()
  0.00      0.01     0.00     1558     0.00     0.00  QTypedArrayData<unsigned short>::data()
  0.00      0.01     0.00     1110     0.00     0.00  QScopedPointer<QObjectData, QScopedPointerDeleter<QObjectData> >::operator->() const
  0.00      0.01     0.00      984     0.00     0.00  QChar::QChar(unsigned short)
  0.00      0.01     0.00      984     0.00     0.00  QString::size() const
  0.00      0.01     0.00      984     0.00     0.00  QString::operator[](int) const
  0.00      0.01     0.00      891     0.00     0.00  int QAtomicOps<int>::load<int>(std::atomic<int> const&)
  0.00      0.01     0.00      891     0.00     0.00  QBasicAtomicInteger<int>::load() const
  0.00      0.01     0.00      891     0.00     0.00  std::operator&(std::memory_order, std::__memory_order_modifier)
  0.00      0.01     0.00      643     0.00     0.00  QtPrivate::RefCount::deref()
  0.00      0.01     0.00      640     0.00     0.00  bool QAtomicOps<int>::deref<int>(std::atomic<int>&)
  0.00      0.01     0.00      640     0.00     0.00  QBasicAtomicInteger<int>::deref()
  0.00      0.01     0.00      640     0.00     0.00  std::__atomic_base<int>::operator--()
  0.00      0.01     0.00      639     0.00     0.00  QString::~QString()
  0.00      0.01     0.00      618     0.00     0.00  std::remove_reference<QVariant::Private&>::type&& std::move<QVariant::Private&>(QVariant::Private&)
  0.00      0.01     0.00      607     0.00     0.00  QChar::QChar(int)
You can see a breakdown of where the time is spent and the number of calls to each routine. Watch out for a known bug with some versions of gcc on Ubuntu that prevents gprof from producing any output.
qmlprofiler
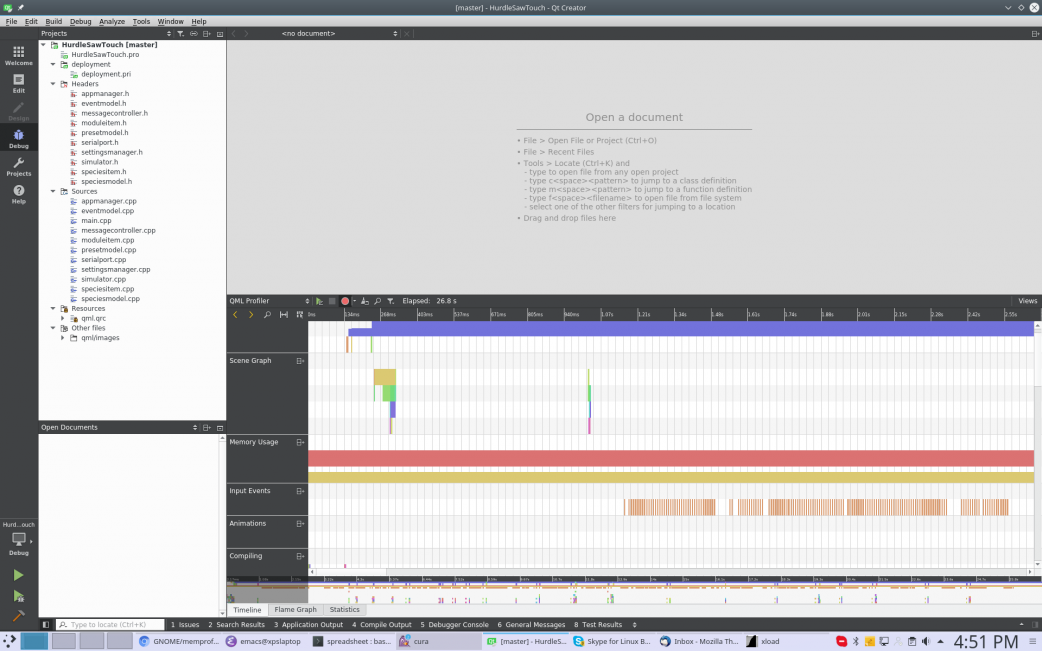
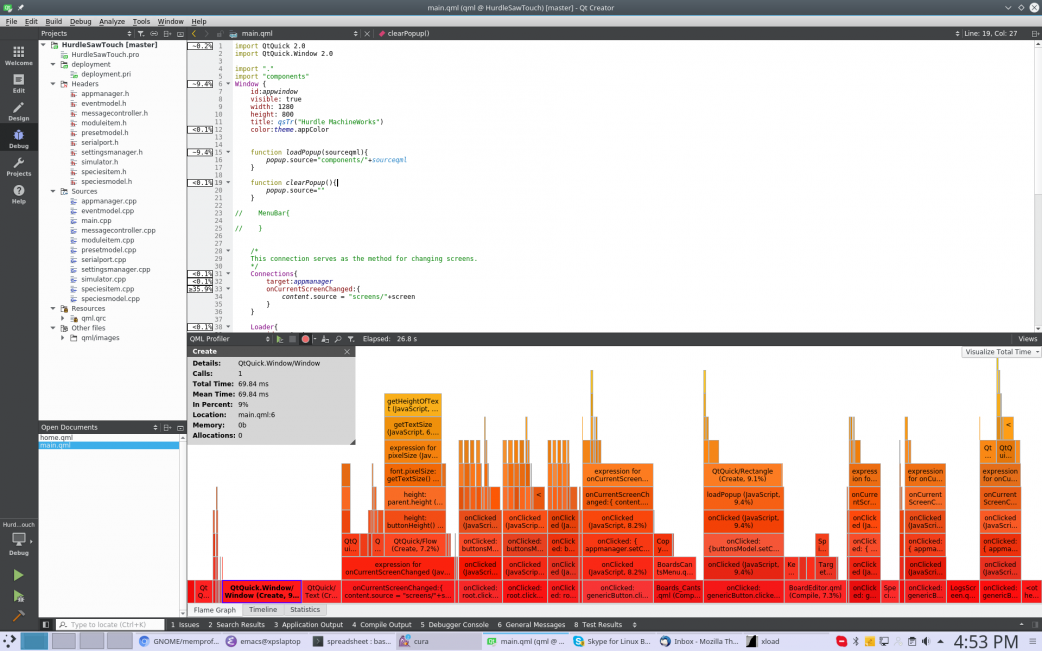
QML code runs in a just-in-time (JIT) compiled virtual machine, making it hard to relate results from a C++ profiler to the QML code level. Fortunately, Qt provides a QML profiler that retrieves QML performance data from an application. The easiest way to analyze the data is to use Qt Creator which has support for visualizing the results in various ways.
Below are some screen shots of the QML profiler in action.


The profiler even supports running QML applications on embedded platforms. See the Qt Creator documentation for details on how to use the QML profiler.
Valgrind
Valgrind is a suite of tools for debugging and profiling programs. Several of the tools are useful for profiling.
Cachegrind is a cache and branch-prediction profiler. Callgrind is a call-graph generating cache and branch prediction profiler, and Massif is a heap profiler.
You can run the programs to be profiled under Valgrind's tools, compiling them normally, although debug information is helpful. The profile data is written out to a file when the program exits. Tools are provided to analyze the recorded profile data.
As an example, I can run a program called "spreadsheet" under the callgrind tool as follows:
valgrind --tool=callgrind ./spreadsheet
I can then generate a report of the profiling data using the callgrind_annotate program. Here is an example with partial output:
% callgrind_annotate callgrind.out.24177

Profiled target:  ./spreadsheet (PID 24177, part 1)
Events recorded:  Ir
Events shown:     Ir
Event sort order: Ir
Thresholds:       99
Include dirs:
User annotated:
Auto-annotation:  off

--------------------------------------------------------------------------------
           Ir
--------------------------------------------------------------------------------
1,437,853,829  PROGRAM TOTALS

--------------------------------------------------------------------------------
         Ir  file:function
--------------------------------------------------------------------------------
108,541,822  ???:0x00000000002df8d0 [/usr/local/Qt-5.9.1/lib/libQt5Gui.so.5.9.1]
 81,804,574  ???:0x0000000000341550 [/usr/local/Qt-5.9.1/lib/libQt5Gui.so.5.9.1]
 59,616,552  ???:QTableWidget::item(int, int) const [/usr/local/Qt-5.9.1/lib/libQt5Widgets.so.5.9.1]
 57,115,964  ???:QColor::toHsv() const [/usr/local/Qt-5.9.1/lib/libQt5Gui.so.5.9.1]
 50,162,367  ???:0x0000000000341660 [/usr/local/Qt-5.9.1/lib/libQt5Gui.so.5.9.1]
 48,525,144  ???:0x00000000004610c0 [/usr/local/Qt-5.9.1/lib/libQt5Gui.so.5.9.1]
 45,077,576  ???:QAbstractItemModel::hasIndex(int, int, QModelIndex const&) const [/usr/local/Qt-5.9.1/lib/libQt5Core.so.5.9.1]
 41,765,591  /build/glibc-mXZSwJ/glibc-2.24/malloc/malloc.c:_int_malloc [/lib/x86_64-linux-gnu/libc-2.24.so]
 37,502,409  ???:FcStrSetMember [/usr/lib/x86_64-linux-gnu/libfontconfig.so.1.9.0]
 33,429,574  ???:0x00000000000206a0 [/usr/lib/x86_64-linux-gnu/libfontconfig.so.1.9.0]
 32,028,777  ???:QAbstractTableModel::index(int, int, QModelIndex const&) const [/usr/local/Qt-5.9.1/lib/libQt5Core.so.5.9.1]
 31,655,236  /build/glibc-mXZSwJ/glibc-2.24/string/../sysdeps/x86_64/multiarch/memset-vec-unaligned-erms.S:__memset_avx2_erms [/lib/x86_64-linux-gnu/libc-2.24.so]
 24,314,354  /build/glibc-mXZSwJ/glibc-2.24/malloc/malloc.c:_int_free [/lib/x86_64-linux-gnu/libc-2.24.so]
 23,612,868  ???:QMetaObject::cast(QObject const*) const [/usr/local/Qt-5.9.1/lib/libQt5Core.so.5.9.1]
 22,311,367  ???:0x0000000000019a80 [/usr/lib/x86_64-linux-gnu/libfontconfig.so.1.9.0]
 21,192,165  ???:0x00000000004086f0 [/usr/local/Qt-5.9.1/lib/libQt5Widgets.so.5.9.1]
 18,543,146  ???:0x0000000000408730 [/usr/local/Qt-5.9.1/lib/libQt5Widgets.so.5.9.1]
 16,918,023  ???:0x0000000000313bc0 [/usr/local/Qt-5.9.1/lib/libQt5Gui.so.5.9.1]
 16,679,692  spreadsheet.cpp:Spreadsheet::recalculate() [/home/tranter/git/inactive/spreadsheet/spreadsheet]
 16,364,936  spreadsheet.cpp:Spreadsheet::cell(int, int) const [/home/tranter/git/inactive/spreadsheet/spreadsheet]
The cachegrind tool works in similar fashion:
% valgrind --tool=cachegrind ~/git/inactive/spreadsheet/spreadsheet
We can analyze the output with the cg_annotate program:
% cg_annotate cachegrind.out.29852

--------------------------------------------------------------------------------
I1 cache:         32768 B, 64 B, 8-way associative
D1 cache:         32768 B, 64 B, 8-way associative
LL cache:         6291456 B, 64 B, 12-way associative
Command:          /home/tranter/git/inactive/spreadsheet/spreadsheet
Data file:        cachegrind.out.29852
Events recorded:  Ir I1mr ILmr Dr D1mr DLmr Dw D1mw DLmw
Events shown:     Ir I1mr ILmr Dr D1mr DLmr Dw D1mw DLmw
Event sort order: Ir I1mr ILmr Dr D1mr DLmr Dw D1mw DLmw
Thresholds:       0.1 100 100 100 100 100 100 100 100
Include dirs:
User annotated:
Auto-annotation:  off

--------------------------------------------------------------------------------
           Ir      I1mr   ILmr          Dr      D1mr    DLmr          Dw      D1mw    DLmw
--------------------------------------------------------------------------------
1,070,559,190 6,725,637 82,719 281,622,232 2,306,173 211,674 178,419,803 2,617,877 444,527  PROGRAM TOTALS

--------------------------------------------------------------------------------
         Ir      I1mr   ILmr          Dr      D1mr   DLmr         Dw      D1mw    DLmw  file:function
--------------------------------------------------------------------------------
515,825,242 2,451,851 40,249 149,486,575 1,038,727 52,389 64,259,997 2,263,401 290,026  ???:???
 63,489,222    16,966      8  15,036,921       316      8 10,024,614        65       0  ???:QAbstractItemModel::hasIndex(int, int, QModelIndex const&) const
 45,110,763    25,452     19   8,353,845         0      0 15,036,921     5,815       0  ???:QAbstractTableModel::index(int, int, QModelIndex const&) const
 37,502,409       229      2   9,149,500    19,021      0          0         0       0  ???:FcStrSetMember
 33,357,962     1,663      4   8,338,901     2,322    106  6,671,036         3       0  ???:QMetaObject::cast(QObject const*) const
 31,634,686         0      0       5,034         3      0 31,604,482     6,531   4,236  /build/glibc-mXZSwJ/glibc-2.24/string/../sysdeps/x86_64/multiarch/memset-vec-unaligned-erms.S:__memset_avx2_erms
 27,750,915    36,605     30   4,714,271       598      3  2,878,820       359      16  ???:QColor::toHsv() const
 26,597,408       132      6   6,649,352        13      0  4,987,014         0       0  ???:QTableWidget::item(int, int) const
 24,064,424   245,619     90   3,692,286    67,653  1,354  3,929,888    69,166  23,545  /build/glibc-mXZSwJ/glibc-2.24/malloc/malloc.c:_int_malloc
 23,721,216       143      3   8,503,744        64      0  1,726,592         0       0  /home/tranter/git/inactive/spreadsheet/spreadsheet.cpp:Spreadsheet::recalculate()
 23,272,732       132      5   8,311,690         0      0  8,311,690         0       0  /home/tranter/git/inactive/spreadsheet/spreadsheet.cpp:Spreadsheet::cell(int, int) const
 13,150,815   198,722     43   3,345,520    21,779  2,851  1,422,781     1,683      60  /build/glibc-mXZSwJ/glibc-2.24/malloc/malloc.c:_int_free
  8,325,374       668     34   1,085,895       225     72          0         0       0  /build/glibc-mXZSwJ/glibc-2.24/string/../sysdeps/x86_64/multiarch/../strchr.S:__GI_strchr
  7,035,035    17,013     10   2,051,809     5,700     30    439,262       663      25  /build/glibc-mXZSwJ/glibc-2.24/malloc/malloc.c:malloc
  6,827,288     3,828    150   2,475,315   169,387 10,785    856,358     1,064      94  /build/glibc-mXZSwJ/glibc-2.24/elf/dl-lookup.c:do_lookup_x
  6,781,474    22,891     72   1,258,683     1,810      9    908,922       340      40  ???:QColor::toRgb() const
  6,705,028         0      0   1,676,077     1,882    119          0         0       0  ???:QMetaObject::inherits(QMetaObject const*) const
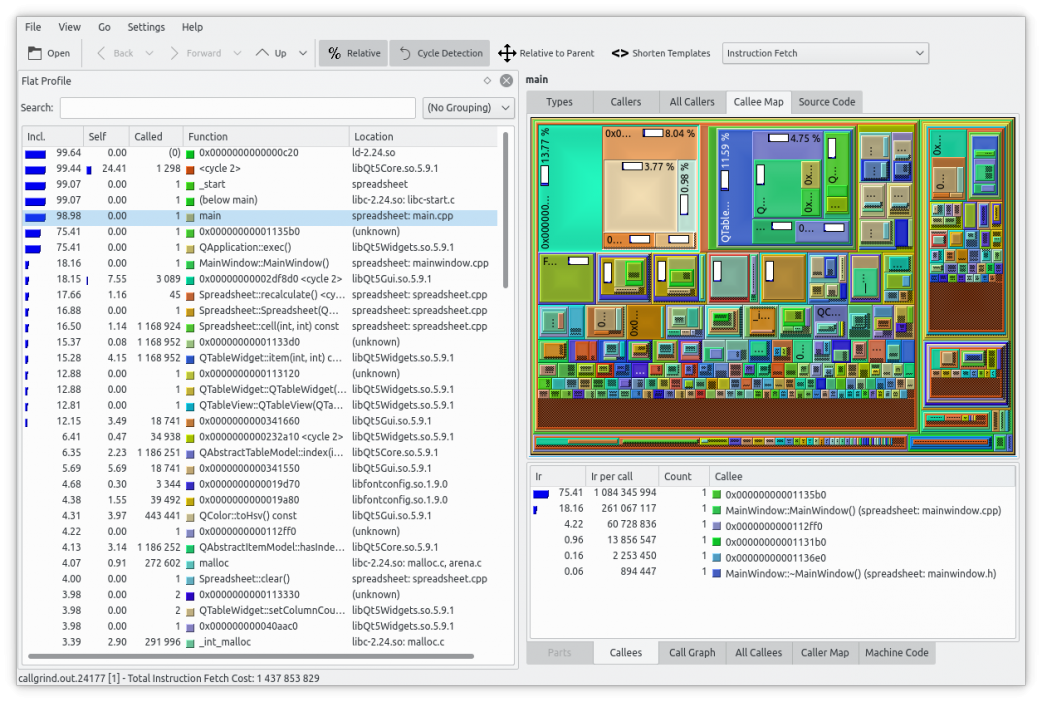
KCachegrind is a Qt-based tool (it is part of the open source KDE project) that allows you to graphically control and visualize the profiling output from Valgrind. Below is a screenshot showing some of the data generated by callgrind:

I'll mention Valgrind again in a future instalment of this blog series when we talk about memory and resource leak detection tools.
Perf and the Hotspot Profiler
Perf is a set of performance analysis tools for Linux. It uses a feature of recent Linux kernels known as performance counters. A sample run might look like this:
% perf record spreadsheet
[ perf record: Woken up 1 times to write data ]
[kernel.kallsyms] with build id 7c8c788beae20d9f1f343f97a391d74aaa471add not found, continuing without symbols
[ perf record: Captured and wrote 0.034 MB perf.data (579 samples) ]
Analyzing the output of perf can be tedious. KDAB recently wrote a Qt-based GUI to visualize the output, called hotspot. You can get more details from the references listed at the end of this post.
Oprofile
Oprofile is an open source tool for statistical performance profiling. It runs on Linux systems and uses the hardware performance counters of the CPU to perform profiling of code with low overhead. It allows all code to be profiled including applications, interrupt handlers, kernel code and shared libraries.
I wrote an entire blog post on oprofile, so I will simply refer you to that posting for more details.
GPU Profiling Tools
The previously described tools help analyze the usage of the CPU, but modern graphical applications typically also make extensive use the the GPU - the Graphics Processing Unit. The GPU can also be a bottleneck for performance. To profile GPU usage you need to use a different set of tools, and typically these are specific to the manufacturer of your GPU chipset. I have only limited experience with these tools, but here are a few programs you can use, depending on the hardware platform you are using:
radeontop - for AMD Radeon GPUs.
aticonfig - For AMD ATI GPUs.
intel-gpu-tools - for Intel GPUs.
nvidia-smi - for NVIDIA GPUs that use the System Management Interface.
If you are using OpenGL, there are profiling tools that can work at the OpenGL level as well.
Summary
I hope you found some tools here that merit more investigation when the time comes that you want to profile your application. In the next instalment we'll explore tracing tools.
References
- https://gcc.gnu.org/
- http://doc.qt.io/qtcreator/creator-qml-performance-monitor.html
- http://valgrind.org/
- http://kcachegrind.sourceforge.net/html/Home.html
- https://perf.wiki.kernel.org/index.php/Main_Page
- https://www.kdab.com/hotspot-gui-linux-perf-profiler/
- https://github.com/KDAB/hotspot/
- http://oprofile.sourceforge.net/about/
- https://www.ics.com/blog/oprofile-profiler
- https://github.com/clbr/radeontop
- https://wiki.debian.org/ATIProprietary/Configuration
- https://cgit.freedesktop.org/xorg/app/intel-gpu-tools/
- https://developer.nvidia.com/nvidia-system-management-interface
- https://www.khronos.org/opengl/wiki/Debugging_Tools
- https://wiki.qt.io/Profiling_and_Memory_Checking_Tool