Indispensable Debugging Tools
Experienced software developers tend to build up a set of tools that they find indispensable for development, testing and debugging. But if you ask a group of developers what their "go to" tools are for various tasks, it is surprising how different the answers can be. I've also found that many developers are unaware of some very useful tools that can save hours of effort.
In the Qt Developer's Bag of Tricks series, which kicks off with today's post on debuggers, I'll cover several tools that the development team here at ICS has found useful.
Scope
Software development covers a wide scope: different programming languages, operating systems, and hardware platforms. For the purpose of this series I'll focus on tools I feel are applicable to Qt developers programming in C++ or QML. The scope will include desktop, mobile, as well as embedded platforms. I'll focus mostly on free/open source tools, but may also stray into some commercial products.
While any attempt to categorize tools is somewhat arbitrary, over the course of the series I will follow this general grouping:
- Debuggers
- Performance profiling tools
- Tracing tools
- Memory/resource leak detection tools
- Static analysis tools
- Embedded tools
- Simulators
- IDEs
- Miscellaneous
Up first, we'll look at some options for debugging tools.
Debuggers
Debuggers typically go hand in hand with the compiler you are using. In Windows, that often means Microsoft Visual Studio and its debugger. On Mac OS with XCode it is the lldb debugger, and on Linux using gcc, usually the gdb debugger. You may also be familiar with gcc on Windows, usually in the form of MinGW, which can be debugged with gdb.
You may not know that the Clang compiler used on MacOS and iOS is also supported on Linux as well as the lldb debugger, and is available on most Linux distributions. It is not yet officially supported by Qt as a compiler on Linux, but likely will be at some point in the future. Clang is much more than just a compiler, and I'll have more to say about it in future posts in this series.
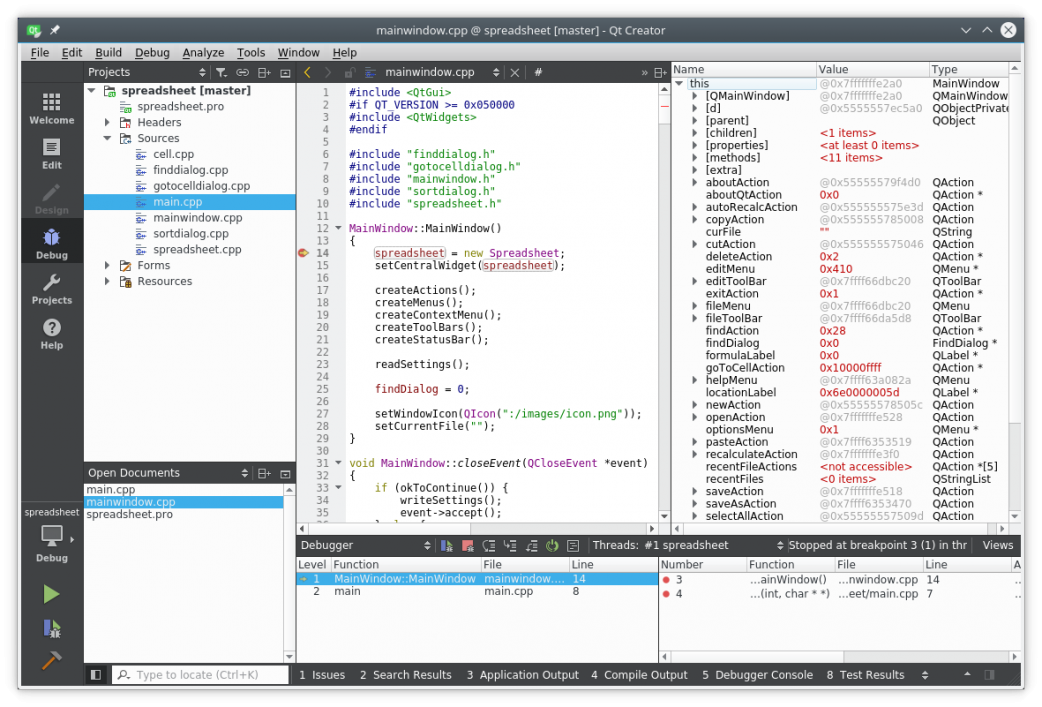
Gdb has a powerful but sometimes cryptic command line user interface. While I am generally a command line type of person, an Integrated Development Environment (IDE) can isolate you from the low-level debugger commands and boost your productivity. Qt Creator, for example, can communicate with a gdb server running on a remote target through a network or serial interface and make debugging almost as easy as with a desktop application running locally on your development computer. If you don't use an IDE, there are standalone GUIs available for gdb.

That said, I recommend you become familiar with at least the basic gdb commands for those cases where you might have to debug code locally on an embedded device or through a remote login where you only have the command line available. There are handy gdb quick reference guides available, ranging from one page to small booklets.
Most debuggers have a large number of commands and features that are occasionally very useful. It can really pay off to spend some time reviewing the features. I was recently studying assembly language programming on the Raspberry Pi 3, and had the opportunity to learn about the commands used for machine code level debugging on the ARM processor.
Conclusions
I encourage you to try some of these tools, and to bookmark this blog series so you can refer to it when you have a need for specific tool. In the coming weeks I'll cover more of the categories of tools outlined above. If there are particular tools you've found indispensable, share them in the comments section. I'm sure the community would be more than interested!
References
- GDB: The GNU Project Debugger, https://www.gnu.org/software/gdb
- Clang: A C Language Family Frontend for LLVM, https://clang.llvm.org
- The LLDB Debugger, https://lldb.llvm.org